CUSTOMER JOURNEY TRACE

Every CX interaction on one timeline

From carrier to IVR to voice AI to human agent, across any system — open any span for the attributes, metrics, events, and logs beneath it.

Talk to us
Experis Manpower Group Logo
Adobe company logo with stylized red 'A' and red text on black background.
ServiceNow SVG Logo
Cochlear Grey Logo
3M Grey Logo
Accenture Grey Logo
IAG logo with white lowercase letters on a purple circular background.
AMP logo with stylized leaf design.
Experis Manpower Group Logo
Adobe company logo with stylized red 'A' and red text on black background.
ServiceNow SVG Logo
Cochlear Grey Logo
3M Grey Logo
Accenture Grey Logo
IAG logo with white lowercase letters on a purple circular background.
AMP logo with stylized leaf design.
4 of the Top 10 Global Software
2 of the top 10 U.S. Healthcare
Top 3 Global Pharma
2 of the Top 5 UK Banks
Top 3 Global Travel
10 Fortune 500 Industrials & Insurance Leaders

4 of the Top 10 Global Software
2 of the top 10 U.S. Healthcare
Top 3 Global Pharma
2 of the Top 5 UK Banks
Top 3 Global Travel
10 Fortune 500 Industrials & Insurance Leaders


The Customer Journey Trace® brings every step of a CX interaction together, across every platform. Failures, handoffs, and drop-offs, surfaced in the order they happened, in one unified view.

BENEFITS

Reduce time to resolution

AI-powered insights are automatically correlated and tagged to every interaction, cutting through the noise so service managers and IT teams see what matters.

One CX view across every system

The entire journey links together — transfers, escalations, and platform handoffs, measured against audio, context, duration, and drops.

Every incident, with evidence

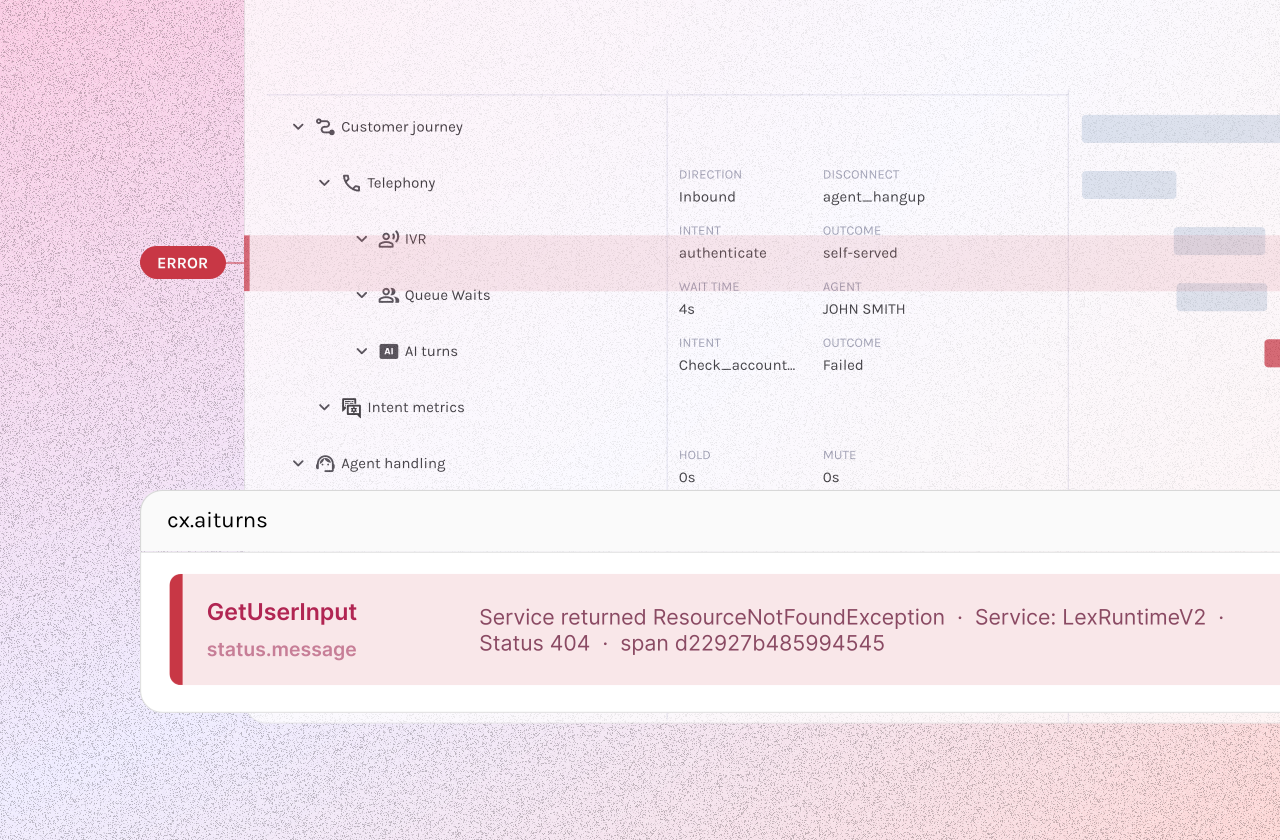
Disconnect reason, wait time, hold, mute, MOS, network type, and CPU sit on the trace beside the AI turn and the API error — objective data for the post-incident review.

Features

Scattered systems,
one thread

The real customer journey, visualized 

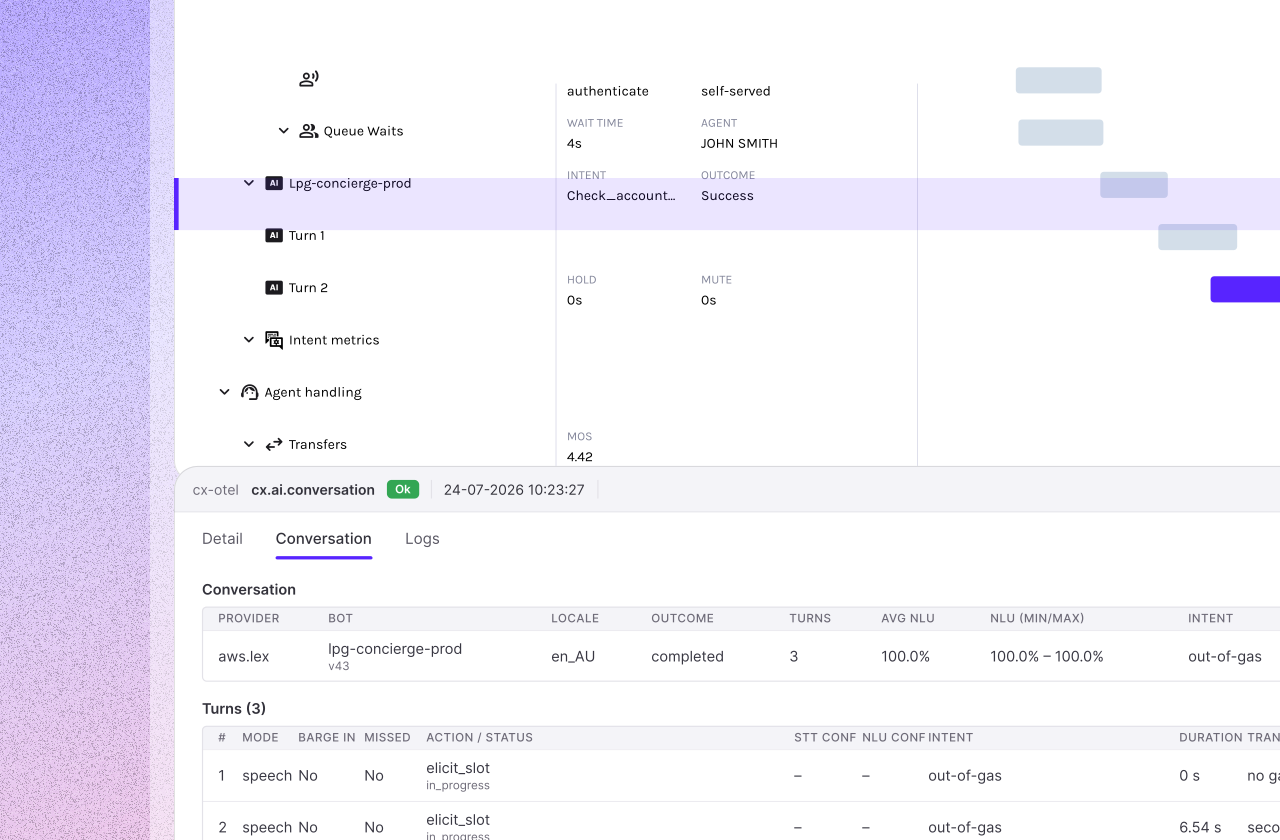
The journey builds as a flame-graph timeline. Each span is a segment of the interaction, in the order it happened, sized by the time it took. Across telephone, IVR, queue, voice AI, transfers, WebRTC and network, open any span for the detail beneath it.

Drill into each interaction

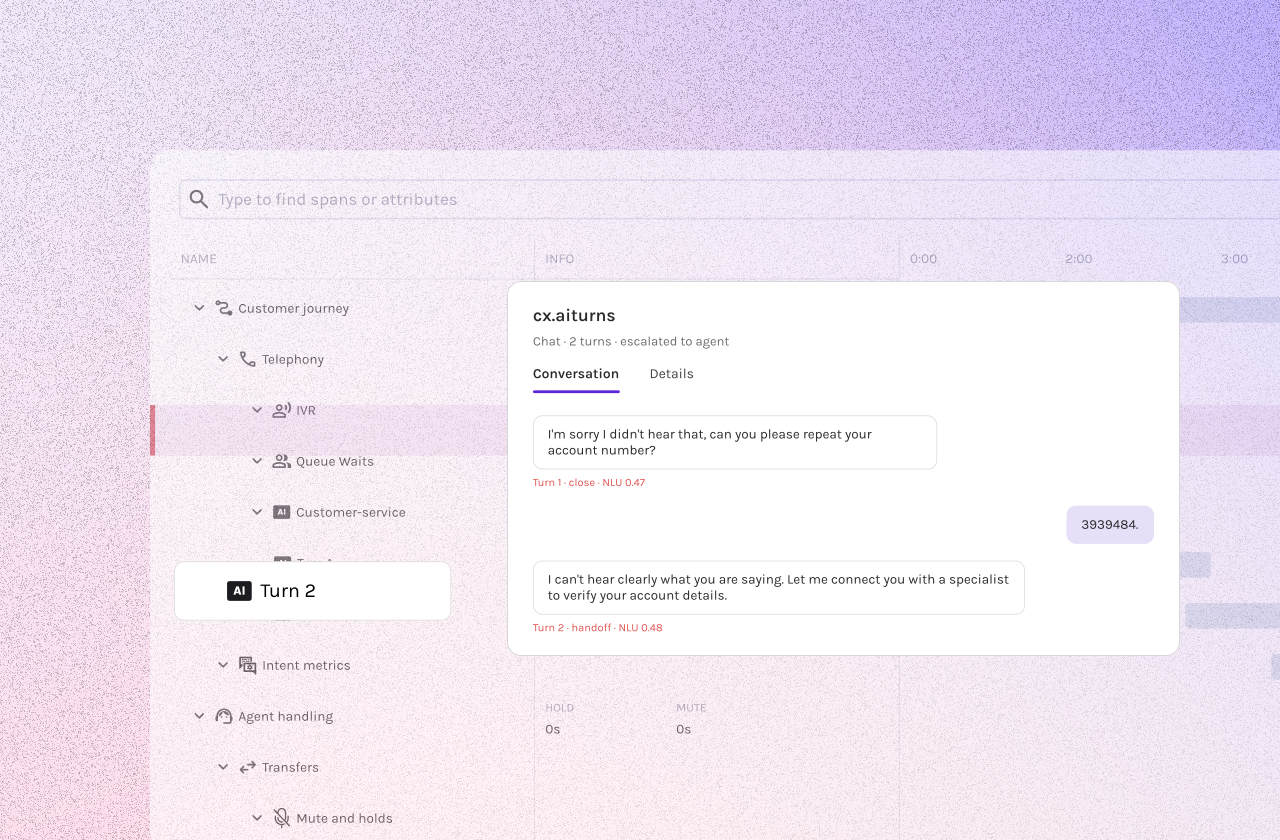
Across telephony, IVR, queue waits, AI turns, intent metrics, agent handling, transfers, mute and holds, WebRTC, and network — the exact error is clearly identified, providing evidence of what happened.

Tool calls and latency

Every API the AI calls appears as a span, with latency, errors, and timeouts. When a downstream service runs slow, the customer sits in silence. Pinpoint the timeout and the context it dropped.

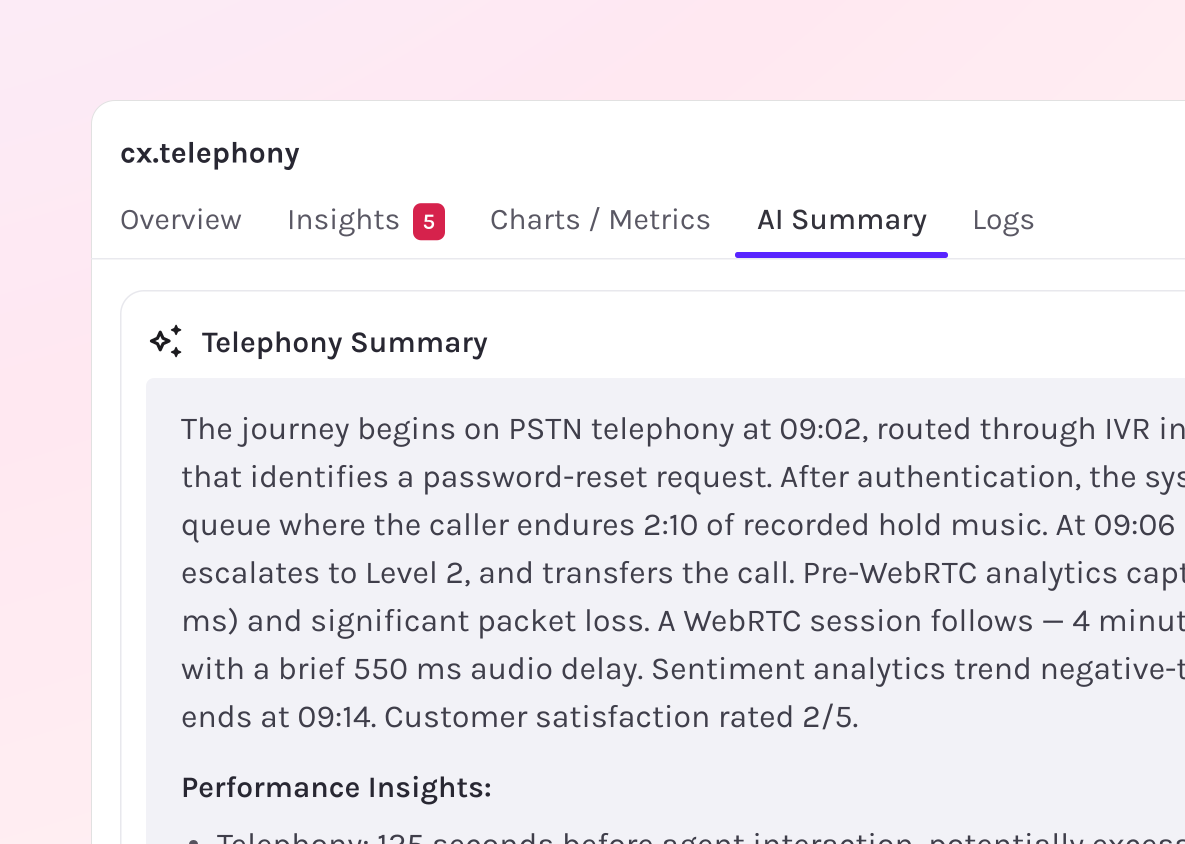
AI summaries

Every trace comes with an AI Summary automatically, helping teams understand the customer journey, isolate problem areas, and focus investigations where they matter most.

Case Studies

Powering performance for the worlds
best Contact Centers

    CX Observability delivers end-to-end visibility across every interaction…Think of it as Datadog for contact centers.

Nicolas De Kouchkovsky
No Jitter

Read case studies
No Jitter Purple Logo
Customer Journey Trace

Frequently asked questions

Where can I find out more about the Operata MCP Server?

Visit the Operata Docs for a deeper dive into the Operata MCP Server.

What AI systems can connect to Operata with MCP ?

The Operata MCP Server lets you query and retrieve CX observability insights directly from AI-powered clients such as Cursor, OpenAI Codex, Claude Code, or your own AI agents.

How does Operata MCP Server enable security?

The Operata MCP server acts as a single, governed bridge - enforcing Operata's permissions and governance rules. An AI Agent can only access the specific data for which its user is authorized.

What is the Operata MCP Server?

The Operata MCP Server acts as a bridge between your CX observability data in Operata and any AI agents that support the Model Context Protocol (MCP). Providing structured access to relevant Operata contexts, features, and tools:

Query metrics, logs, traces, errors, and insights

Access context relevant t to the CX, Contact Center, CCaaS, AI Customer Service and Voice AI domains and CX Observability.

What is MCP?

MCP refers to the Model Context Protocol, an open standard for AI systems to connect with external tools and data.

What it is:

A standardized communication protocol that enables large language models (LLMs) to interact with the outside world. It allows AI agents to access new information and use tools like spreadsheets, databases, or code repositories.

How it works:

It acts like a universal translator, enabling a client (the AI application) to connect to an MCP server that handles connections to various tools and data sources, such as Operata. This standardizes communication, avoiding the need for custom integrations for every tool.

Benefits:

It reduces hallucinations by providing access to real-time, reliable data and increases AI utility by enabling more complex tasks and automation.


What are some typical use cases for MCP Server in my organisation?

Here are some roles an typical use cases (and prompts) that Operata MCP Server could help with:

Technical Operations / NOC

  • “Show me which services had the most packet loss in the last 2 hours.”
  • “Find all logs mentioning ‘jitter’ or ‘dropped audio’ in the last hour from agent-gateway.”
  • “Which traces in the Sydney region had error spans in the last 12 hours?”
  • “Drill into the worst trace from sales queue with errors today.”
  • “Find anomalies in disconnects by region in the last 7 days.”

Contact Center Operations

  • “Compare abandon rate by queue this week vs last week.”
  • “Find traces where customers got stuck in the IVR after the VerifyCustomer step.”
  • “Which queues had the highest AHT during business hours yesterday?”
  • “Show me logs where the transfer latency exceeded 5 seconds.”
  • “Which IVR flows are triggering the most disconnects recently?”

Workforce Management / Forecasting

  • “Show me call arrival rate by queue every 15 minutes for the last 7 days.”
  • “Which queues had a spike in abandon rate after 6pm?”
  • “Compare AHT by queue between two custom date ranges.”
  • “Find unusual patterns in call volume by hour over the past week.”
  • “Which regions are showing rising handle times during lunch hours?”

CX / Product / IVR Teams

  • “Which IVR steps have the highest p95 latency in the last 24 hours?”
  • “Find traces where the agent answered after a 60s delay.”
  • “Show me a timeline of what happened in call CALL-8839.”
  • “Compare IVR completion rate for flow X before and after we launched v12.4.”
  • “Find logs that mention ‘lex timeout’ from IVR microservice.”

CXOs / Executives

  • “Show me MOS, AHT, and abandon rate by platform for the past month.”
  • “What changed in customer experience metrics last week compared to the week before?”
  • “Summarise the biggest anomalies in the last 7 days across regions.”
  • “Which queues are showing improving MOS scores over the last month?”
  • “Highlight regions where abandon rate is consistently high.”

Get Started

Ready to bring CX Observability to your contact center?

See how Operata empowers IT and Ops teams to intelligently resolve issues and improve interactions in your contact center.

Book a Demo