Most of us open a chat window before we tap a colleague on the shoulder. The answer comes back fast, shaped the way we asked for it. What makes it useful is what the assistant is connected to. An AI assistant without access to your enterprise system is giving you a well-written guess.
The data no other system holds
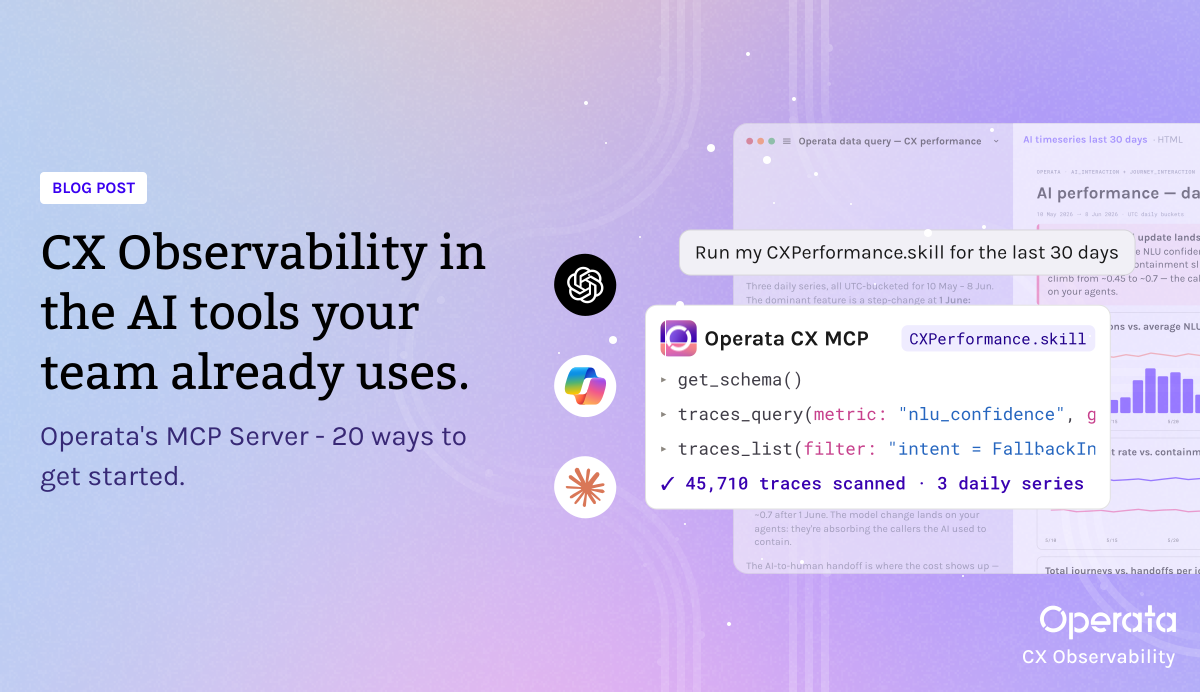
Operata's MCP Server builds CX Observability data and insights into the context of your enterprise systems, in any chat. That real time, end-to-end data, connected to the systems you use every day, that’s how you balance the speed of scale with control, governance and analytics.
Cut the hours you spend investigating, and catch the trends affecting CX before customers feel them. Correlate and aggregate the data that enables you to find the inefficiencies costing you money, tune your voice AI cohorts, and see where audio quality stopped a bot performing the way it was designed to.
One connection, one standard
Connect Operata to Claude, ChatGPT, Copilot, Cursor, or anything else that speaks the Model Context Protocol. It's one open standard, so there's no custom integration to build and nothing to maintain when you switch assistants.
The assistant reads the live record every time. No exported reports, no second platform login, no stale extract someone pulled last Tuesday.
What you can do with it
- Find the calls that matter. Filter traces by attribute, aggregation, and time range.
- See the whole root cause. Pull the full OpenTelemetry trace: every span, log, and Operata insight.
- Find the trend and spot patterns. Measure trends and outliers across every service.
- Get the metric, the definition and the documented fix, without leaving the conversation.
- Query the right tenant. Every call, scoped to the group you pick.
Every tool is built for a class of question, so you get the same answer to the same question twice. Operata’s MCP returns facts and figures from the interactions you need to watch, as well as the context from our knowledgebase. There’s no guessing.
Telemetry tells you what happened. Operata's knowledge and documentation tells you what the measure means, what good looks like, and how to fix it. Your AI assistant reads both, gathering everything you need to point to one clear answer.
Every Operata answer traces to your telemetry and our documentation. What data your other systems contribute, they own.
Telephony errors and audio quality
CONTEXT
CONNECTORS
Operata MCP
pd-trigger
SKILLS
voice-ai-incident-response
I am seeing telephony errors that are impacting bot confidence and apparently causing audio quality issues. What do I do next?
Used Operata MCP, loaded a skill, ran 3 tool calls
MOS on affected legs — baseline 4.2, severe threshold 3.0
Inbound loss — avg 8.4%, peak 14.2%
Outbound loss — avg 6.1%, peak 11.7%
Used pd-trigger integration
Build with your AI, grounded in Operata data
A prompt answers today's question. A schedule answers it before you think to ask.
Below are 20 places teams start. Ask the question, run the investigation, get to the root cause in minutes, then keep going.
Operata’s MCP Server is infrastructure your agents build on, so the prompts you write, the projects you save, the skills you add, and the connectors you join all compound from there.
The questions you ask twice become standing artifacts. Set them up once, then let them run. Here's how you could start building the automations that hand you the information you need, when you need it.
Daily, to the operations lead: yesterday's volume, queue waits, transfer hotspots, and flow node failures, each scored against its 7-day baseline. Closes by naming where to flex staff today.
Weekly, to team leads and CX: the five fixable items this week, ranked by cost or CSAT impact, each with the journeys behind it and a suggested fix.
Monthly, to leadership: the cost of time spent in queue, joined with your own finance figures, and a CSAT root cause review clustering low scores by common drivers.
Event-triggered: a queue drifting off its baseline, a campaign about to launch, a change window closing, a named account with a failure on it. These fire on the signal, not the calendar. Each one appears in the list below.
Two rules make a scheduled artifact land. End it with a recommended action and a named owner. Compare it against the last run, so the reader sees whether last week's flagged item moved.
What happened inside the interaction
Operata knows what happened inside the interaction. The agent's device, the network path, the carrier, the WebRTC session, the voice AI turn. No other system in your stack holds that.
Your CRM knows who the customer is, your ITSM knows what changed last night, your WFM knows who was rostered. Each one answers half a question.
We shipped the MCP Server in beta behind an API key, and customers told us the same thing: the value showed up when Operata sat next to their CRM, their ticketing, and their workforce data in the same conversation.
"Take this customer in our CRM, pull their last 20 Operata journeys, and tell me what their experience has been." Until now, answering that meant a project with a business case attached.
Different ways teams are using the MCP
Root cause
Find the root cause
Today your team proves where a problem lives. You gather the MOS trend, the carrier spans, the device telemetry and the change window, then build the case. During an incident that work takes hours you do not have.
01
Cross-stack root cause
Voice quality dropped in this region over the last two hours. Was it us, the carrier, an agent-side issue, or a platform event?
02
Upstream or downstream
Split yesterday's degraded sessions by where the fault sat: carrier path, CCaaS platform, agent network, or endpoint.
03
Repeat incident pattern
We have had three quality incidents in this location this quarter. What do they share?
04
Voice AI failure attribution
Find the bot conversations that failed to contain this week. Separate design failures from speech recognition failures from audio quality failures.
05
Silent dead ends
Which IVR or flow nodes are dropping customers without an error?
Fleet and change
Fleet health and change control
The same data, used before the incident rather than during it.
06
Agent fleet health
Which agents show a worsening trend in audio quality, CPU pressure or network stability this month, and does it cluster to a device class, browser version or location?
07
Change and release validation
We pushed a config change on Tuesday night. Compare quality metrics for the affected queues before and after the window.
08
Endpoint cohort regression
Did the browser update this month degrade WebRTC performance for any cohort of agents?
Cost
Cost and investment realization
When the board asks whether the investment is performing, the answer travels up through three teams and arrives as a slide someone built by hand. Each question here runs against your own cost figures.
09
Cost of abandonment
What did abandoned-in-queue interactions cost us last month, by queue, using our cost per minute?
10
Hold time reduction model
Model the saving if we cut average hold time by 20% across the top five queues.
11
Self-service failure cost
Which self-service flows fail most often, and what does agent handling of those failures add to cost of service?
12
CCaaS investment realization
Which platform capabilities are underperforming against how we configured them, and what is that costing in handle time?
13
Cost of repeat contacts
Show this week's repeat callers, what they were trying to resolve each time, and whether a technical failure sent them back.
Risk and assurance
Risk, assurance and vendor accountability
Your vendors measure their own SLAs and report on their own performance. These four give you a version of the truth that is yours.
14
Independent SLA evidence
Build the quality evidence pack for this vendor's SLA review period.
15
Baseline drift alert
Alert me when a queue's wait or transfer rate drifts above its 7-day baseline, and attach the likely cause.
16
Named account watch
For these named accounts, summarize every interaction since the last report and flag anything that went wrong.
17
Campaign readiness check
Before this campaign launches, model expected queue load against current staffing and flag the risk.
Quality
Quality to outcome
Where the interaction data changes what you do about a score, and who you hold responsible for it.
18
Quality to CSAT correlation
Take last month's lowest CSAT journeys and show me the voice quality, hold time and transfer history behind each one.
19
QA scoring
This call was flagged for robotic audio. What were the network and device conditions during it?
20
Coaching the cause, not the symptom
Which agents show consistently poor connection stability over the last 30 days, and does it map to location or working pattern?
Same platform, same permissions
The MCP Server runs on the same foundation as the Operata platform, so it inherits the security, permissions, and reliability you already trust.
You connect once and OAuth carries your Operata permissions across every query run. A team leader sees their team, a BPO sees only their groups, an IT lead sees the infrastructure they manage. Anyone with multiple views switches between them in a single session.
What a person sees in the Operata platform is exactly what their assistant sees through the MCP Server.
Get started
The Operata MCP Server is available now. Connect your assistant to Operata's traces, insights, and knowledge base.
You keep your assistant, your systems, your permissions, and your own way of asking. Operata supplies the layer none of them had.
These 20 are the questions other teams asked first. What you schedule, connect, and build after that runs on data you already own.






.svg)
.svg)