This website or its third-party tools use cookies, which are necessary for its functioning and required to achieve the purposes illustrated in the privacy policy. You accept the use of cookies by closing or dismissing this notice, by clicking a link or button or by continuing to browse otherwise. Learn more
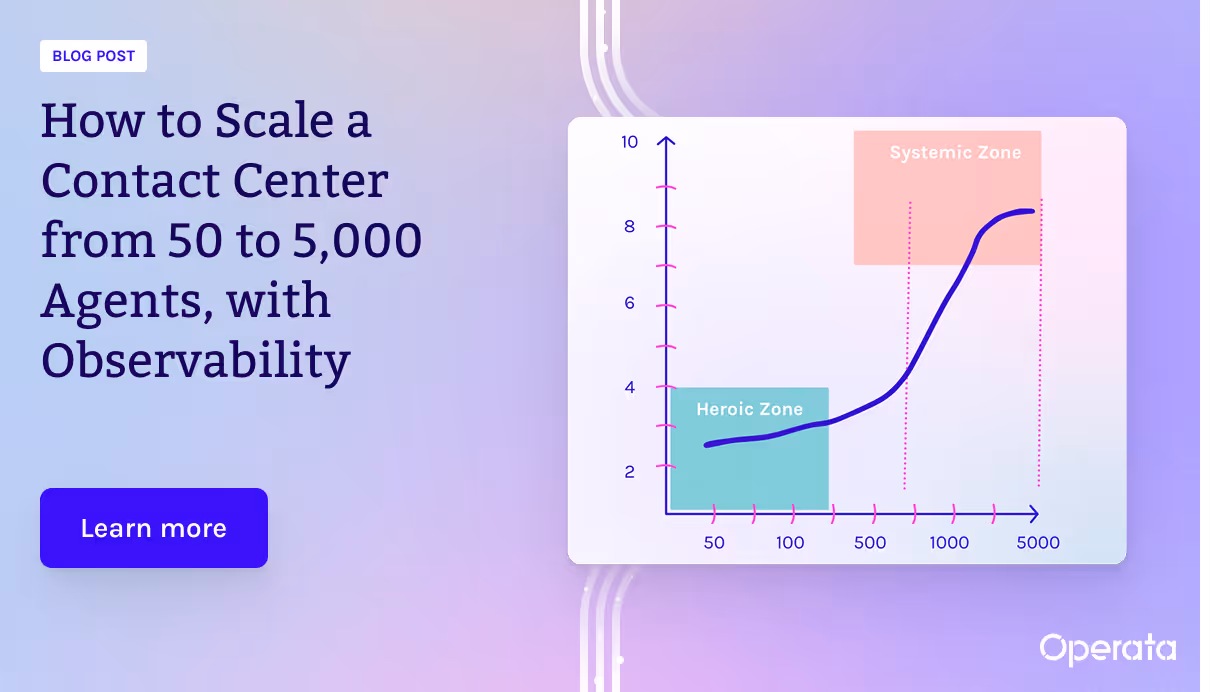
How to Scale a Contact Center from 50 to 5,000 Agents,with Observability
Moving from reactive “heroics” to proactive systems.
At 50 agents, you can still get away with heroics. A senior engineer jumps on a call, someone reboots a router, a supervisor “watches the board” and nudges schedules by instinct. However, at 5,000 agents, spread across homes, hubs, and regions, the same glitch becomes a massive, queue-wide spike in handle time, a CSAT shortfall, and a week of opinionated guesswork.
The difference between these two scenarios isn't the problem itself; it's the system's ability to identify and solve the problem. That’s where CX observability comes in.
CX Observability removes that uncertainty, providing a single source of truth for every interaction, regardless of scale. While the consequences of a problem are magnified at 5,000 agents, the principles of observability are the same, turning reactive heroics into a proactive, data-driven system.
Monitoring tells you that wait times spiked. Observability tells you why. The "why" lives in the seams, device, network, platform, and AI, and it only becomes actionable when those signals sit side-by-side for every interaction. High-growth contact centers don’t scale by adding rules; they scale by shortening the distance from signal to action and making that loop repeatable.
From Heroics to Systems
The challenge of scale isn't linear. The move from 50 to 5,000 agents introduces a new level of complexity:
At 50 seats: One agent down is 2% of your capacity, an immediate and noticeable hit. With fewer vendors, known networks, and tighter change control, you can still “find the person who knows the thing” and fix it. Here, observability acts as a guardrail, turning a potential disaster into a minor, documented event.
At 5,000 seats: One agent down is just 0.02% of your capacity, barely a blip. However, a single, minor issue (such as a new VPN hop, a codec mismatch, or an AI model regression) can ripple across hundreds of simultaneous contacts. The environment is more regulated, with less direct control over BPOs, ISPs, and device types. Observability is the key to making sense of this complexity, transforming rich yet chaotic data into actionable insights.
Monitoring vs. Observability (and Why It Matters at 5,000)
Monitoring answers what happened (e.g., “Average Handle Time spiked in APAC between 10:05 and 10:20”).
Observability answers why by stitching together the full path of a single customer contact. This includes data from:
Network: Per-hop latency, jitter, packet loss, due to quality of service markings, VPN, firewall, and Zero Trust Network Access.
End-to-End Interaction: SIP/RTC call IDs, IVR transfers, agent state transitions, codec negotiations, plus AI stages, Automatic Speech Recognition (ASR) latency, and confidence scores.
Change Context: Who changed what, and when, from policy rollouts to firewall changes.
When these signals are side-by-side for every interaction, the cause of an issue isn’t a debate; it’s a line you can point to.
This ability to pinpoint the cause is what transforms a contact center from a reactive operation to a proactive, data-driven one. It allows you to move beyond broad reports and into a continuous cycle of observation, explanation, and improvement.
This is a continuous process, essentially the OODA loop (Observe, Orient, Decide, Act) for customer experience. Each pass makes the next one faster:
OODA Loop in Practice for Contact Centers
OODA Step
Our Loop
In Practice for Contact Centers
Observe
Observe
Capture device, network, flow, and AI timings for every contact. Make the contact itself the unit of truth.
Orient
Explain
Correlate signals to a single, actionable cause. Example: "APAC spike began at 10:06 after a Secure Access Service Edge (SASE) rule change."
Decide
Act
Apply surgical remediation: a targeted route or codec switch, model rollback, or configuration tweak for the specific segment that’s broken.
Act
Verify and Harden
Prove the fix with synthetic testing and live data, then codify it into policy or automation to prevent future regressions.
High-growth teams win by shortening this loop and running it continuously.
At its core, this process is powered by a simple but profound principle: every interaction should tell a complete story, not just a summary. This is what transforms your data from a static report into a dynamic and actionable insight.
Every Contact as a Complete, Inspectable Story
This principle transforms every interaction into a complete, inspectable story. It's the difference between hearing that "a call had high jitter" and understanding a full narrative: "The agent's Wi-Fi signal was weak, which forced the codec to change, causing the audio to break up and the call to re-route to a new server, all of which added 45 seconds to the total handle time." This story reveals the why and points directly to the root cause.
This level of precision provides the confidence to scale. It enables high-growth teams to accelerate without fear of losing control over performance and breaking the system.
Accelerate Your Growth: Observability as a Migration Tool
For years, major contact center migrations from on-premise to the cloud, or from one CCaaS provider to another were defined by fear and friction. They were slow, expensive projects staggered over months with periodic load testing. The process was riddled with blind spots and "go/no-go" anxiety, as a single failure during a high-stakes cutover could impact customer experience and revenue.
Observability completely transforms this approach. It rewrites the rules by turning every live interaction into a continuous, real-time load test. Instead of only relying on simulated traffic that can never fully replicate the complexity of real-world conditions, you use live data from your agents and customers to validate performance.
This means you can see, in real time, how a new network path behaves for remote agents in different regions or how a new AI model performs across a variety of dialects. With this level of real-time insight, you gain the confidence to:
De-risk cutovers in minutes, not months. You can validate a new media path for a segment of agents without fear, knowing you have a complete, inspectable record of their performance.
Unlock Business Agility. Accelerate the adoption of new technologies, like a new cloud provider, with the certainty that comes from validating every critical component before it goes live for your entire operation.
In the past, major migrations like moving to the cloud or ramping up capacity were staggered over months with periodic load testing. Observability completely transforms this approach. By turning every contact into a real-time data point, you get continuous, live load testing as you go. You can de-risk a cutover in minutes, not months, and transition with the confidence that comes from validating the full performance and quality of every live interaction in real time. It’s the shift from a high-stakes project to a proven, repeatable process.
What Really Changes at 5,000 Seats
Variance explodes. You need segmentation by device, ISP, region, gateway, codec, model, and client version to make sense of the noise.
Compliance adds hops. Proxies, VPNs, and inspection can alter packet timing and codecs, introducing new places for degradation to hide.
Vendor surface area grows. When you have CCaaS + telco + network edge + security + AI + endpoint vendors, observability creates a single, neutral record everyone can work from.
The service desk must be data-literate. Tier 1 and 2 should see "explainers," not raw charts: "Known issue: Opus to G.711 fallback on Secure Access Service Edge (SASE) apply policy X or route to Y."
A Quick Scenario: From Symptom to Surgical Fix
Symptom: APAC handle time is up 18% from 10:05 - 10:20.
Monitoring View: “AHT is up; create a war room.” This leads to general discussions and slow, broad-spectrum responses.
Observability View: A change tag at 10:06 highlights a SASE policy update. Data shows jitter increased by 18ms for APAC home-users, forcing a codec renegotiation from Opus (newer codec) to G.711 (older codec). ASR latency increased by 450ms. BPO-Site-2 was unaffected, as it uses a different network path.
Action: Temporarily bypass the SASE for RTP to the CCaaS media edges in APAC, pin the Opus codec, and roll back the policy for that segment.
Verify and Harden: Synthetics confirm jitter is back to baseline, and live MOS and ASR timings normalize within minutes. The fix is codified into a policy guardrail to block similar future changes.
What to Instrument from Day One
To make this vision a reality, instrument your environment to collect the right per-contact signals from the start:
Data Types and Key Signals to Collect
Data Type
Key Signals to Collect
Endpoint
CPU/GPU load, Wi-Fi RSSI/band, and app versions.
Network
Latency/jitter/loss, DSCP, and VPN/SASE identifiers.
Media/RTC
Codec negotiations, jitter buffer stats, and retransmits.
Platform
SIP/RTC IDs, IVR steps, and error codes.
AI
ASR/LLM model versions and inference timings.
Change Context
Release IDs, config diffs and feature flags.
The Metrics That Matter
Global averages are for spreadsheets, not for scaling. To move from guesswork to precision, your focus must shift to the micro-level signals that reveal the root cause of every issue. This means looking beyond broad metrics like AHT and instead examining:
Micro-level performance: Instead of a global average, monitor RTP jitter and loss by segment, tied to specific ISPs or regions. Is your MOS or quality score falling? Your observability data should instantly point to a specific codec renegotiation or a change in latency that explains the drop.
Stability and drift: Are your agents unexpectedly re-queuing or experiencing transfer loops? Observability detects these state anomalies and stability issues as early warning signs. For AI, it’s not simply about AHT, but about latency and confidence drift in your ASR and summarization models, which directly impacts agent efficiency.
By shifting your attention from these symptoms to their underlying causes, you’re moving from simply managing a contact center to building a self-improving system.
From 50 Agents to 5,000: From Heroics to Systems
Ultimately, the journey from managing 50 agents to 5,000 is bigger than adding seats; it's about a fundamental shift from a model of reactive heroics, where individual effort saves the day, to a system of proactive, data-driven resilience.
At 50 agents, you can afford to "fly by instinct." At 5,000, that intuition is replaced by a complete, inspectable story for every single interaction. You stop chasing symptoms and start surgically eliminating root causes.
While the consequences of a glitch are magnified at scale, the principles of observability remain constant. Whether you have 50 agents or 5,000, observability provides the same clarity; it makes the difference between an annoying hiccup and a business-critical outage.
This data-driven approach also reshapes the way you scale. By turning every contact into a real-time data point, you get continuous, live load testing as you go. You can de-risk a cutover in minutes, not months, and transition with the confidence that comes from validating every path, every codec, and every AI model in real time.
Observability is the new foundation for a contact center that helps grow, whilst getting smarter and more efficient with every call.